
Thank you, Mr Pearson.
EDIT: A later post re-ran this analysis with increased accuracy and more reliable conclusions.
Love of money is the root of all quality.
If a minor functional update to your source code costs pots of cash, then your source code is of low structural quality. Period.
Hence, the holy grail of commercial source-code structural analysis is finding a software property that objectively correlates with cost, so that programmers can revile this property as, "Bad structure," and minimize it to minimize cost.
Spot the tricky word in that sentence?
Yup: "Objectively."
We all have opinions. We all think our software cheap and easy to modify. And our opinions are not necessarily wrong, but they are mere opinions.
Will we ever move beyond opinion? Will we ever unearth objective evidence for something as opinion-y as good source-code design?
Well, statistics might offer an answer.
You see, statisticians have this almost unbelievable tool called the Pearson product-moment correlation coefficient. It crunches two sets of numbers and establishes - mathematically and objectively - whether these sets correlate with one another, that is, whether they tend to change together. For example, you might suspect that programmer salary correlates with experience: the more senior the programmer, the more she gets paid. Pearson's coefficient allows you objectively calculate the degree to which this holds for the entire industry.
But how can Pearson judge software structure?
Every method modification entails a cost. Some methods are updated more than others and hence cost more. Why is this? There are two categories of method update: 1) functionally additive updates which add necessary functionality, and 2) functionally neutral updates which just accommodate structural changes caused by (1).
Functionally additive updates take place where they must, indiscriminately, amidst both poorly structured and well-structured code. Functionally neutral updates, however and almost by definition, tend to plague poorly structured code more than well-structured code, because well-structured code offers fewer opportunities for ripple effects to proliferate.
So we'd ideally like Pearson to detect the faint signal from these functionally neutral updates against the great wash of necessary-update background noise.
We do this by making explicit the assumption that, all else being equal, the more a method is updated, the more it costs and the more it costs, the lower its quality. Of course, this does not obtain in all individual cases: some methods may, by chance or design, necessarily require more updates. However, if this bias exists then by examining huge numbers of methods statistically we will eventually expose it.
We then ask Mister Pearson whether the number of times a method is updated correlates with any of its structural properties.
For example, let's say you suspect that large methods signify poor design and hence the larger the method, the more updates it will undergo. You must then both measure the number of times every method is updated during a series of project releases, and measure the average size of each method during those releases. If your hunch is right, Pearson will show you that those methods updated most are also the largest. If your hunch is wrong, then Pearson will spank you like a little b... brat in front of all your friends and work colleagues. Objectivity has no favourites.
And we won't stop with method size. Let's interrogate all the usual suspects blamed for poor design: number of dependencies, code duplication, the lot. This then will produce no new metric, but will evaluate current thinking.
Which methods shall we investigate? To obtain a massive sample size, let's do our usual examination of the update histories of eight open-source projects1 as tens of thousands of methods churn through successive releases2.
Finally, Pearson's correlation coefficient itself is just a number from -1 to 1.
Ignoring negative numbers as they seldom appear in the investigation, a 0 indicates that method size (to continue with the earlier example) has no bearing on the number of times that a method is updated and so offers a poor indicator of development cost. A 1 indicates that the bigger the method, the more it is updated: a perfect development cost predictor.
Table 1 below shows the correlation coefficients calculated for all the properties tested over eight programs - labelled P1 to P8 - with each coefficient averaged over all 8 programs in the final column.
| Property3 | P1 | P2 | P3 | P4 | P5 | P6 | P7 | P8 | Avg. |
| Size | 0.43 | 0.40 | 0.32 | 0.32 | 0.53 | 0.15 | 0.38 | 0.59 | 0.39 |
| Dependencies from | 0.45 | 0.47 | 0.36 | 0.25 | 0.39 | 0.24 | 0.35 | 0.43 | 0.37 |
| Conditional count | 0.35 | 0.33 | 0.16 | 0.29 | 0.36 | 0.20 | 0.32 | 0.48 | 0.31 |
| Impact set | 0.35 | 0.32 | 0.22 | 0.13 | 0.25 | 0.15 | 0.26 | 0.33 | 0.25 |
| Middle-man | 0.23 | 0.24 | 0.14 | 0.18 | 0.25 | 0.10 | 0.19 | 0.13 | 0.18 |
| Complectation | 0.23 | 0.23 | 0.15 | 0.11 | 0.17 | 0.11 | 0.23 | 0.08 | 0.16 |
| Transitive dependencies | 0.14 | 0.07 | 0.11 | 0.20 | 0.28 | 0.13 | 0.25 | 0.12 | 0.14 |
| Potential coupling | 0.22 | 0.18 | 0.08 | 0.05 | 0.17 | 0.04 | 0.15 | 0.10 | 0.12 |
| Amplification | 0.08 | 0.03 | 0.09 | 0.14 | 0.21 | 0.10 | 0.17 | 0.07 | 0.11 |
| Circular dependencies | 0.15 | 0.05 | 0.06 | 0.08 | 0.21 | 0.04 | 0.18 | 0.07 | 0.11 |
| Duplication | 0.07 | 0.08 | 0.16 | -0.03 | -0.02 | 0.07 | 0.07 | 0.16 | 0.07 |
| Dependencies on | 0.04 | 0.02 | 0.01 | 0.11 | 0.05 | 0.02 | 0.03 | 0.04 | 0.04 |
| Impacted set | 0.03 | 0.01 | 0.01 | 0.10 | 0.09 | 0.04 | 0.03 | 0.04 | 0.04 |
Table 1: Pearson correlation coefficients of a method's property vs. number of times that method was updated, over 8 evolving systems.
Before analyzing the results, we can quickly double-check our findings by plotting some method properties against the number of times methods were updated for a specific program.
The stronger correlations should show an average trend upwards as the number of updates increases (e.g., the average size of methods updated 4 times should be higher than the average size of methods updated only 3 times), whereas the lower correlations should show no average trend. And indeed this is the case. Figures 1 - 4 show four sample properties over all methods of FitNesse during 15 consecutive releases: two properties with strong correlation, two with weak.
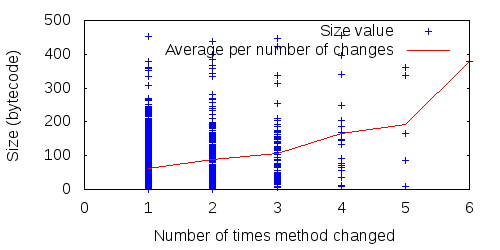
Figure 1: The size (strong correlation) of all FitNesse methods over 15 releases, and average per number of method changes.
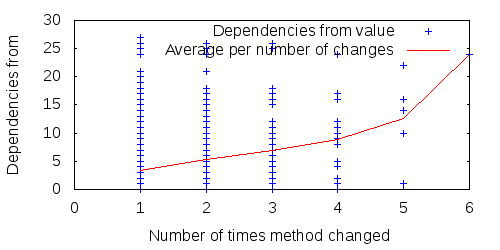
Figure 2: The number of dependencies from (strong correlation) all FitNesse methods over 15 releases, and average per number of method changes.
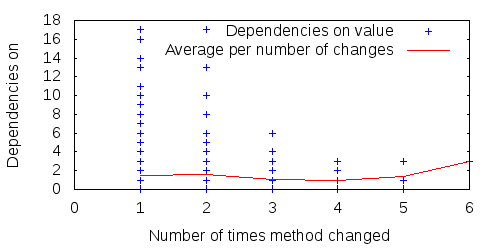
Figure 3: The number of dependencies on (weak correlation) all FitNesse methods over 15 releases, and average per number of method changes.
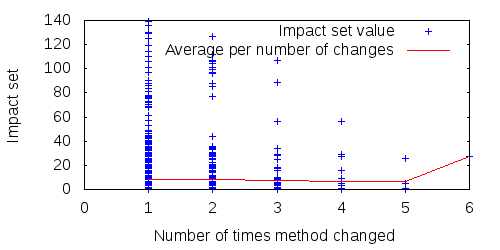
Figure 4: The impacted set (weak correlation) of all FitNesse methods over 15 releases, and average per number of method changes.
The average column in Table 1 presents generally weak correlations between the various properties and the number of times a method changed, but four clearly stand out: method size, the number of dependencies from a method, the number of conditionals in a method and the impact set of a method. The more of these, the more updates a method suffers. These, then, are four4 properties that signify expensive source code.
None of these is a great surprise, of course. Everyone knows that we should avoid large methods, cyclomatic complexity and excessive dependencies. It is, however, nice to see our presumptions' surviving objective scrutiny. Even if the correlations are weak, furthermore, they are far stronger objectively than the evidence we often use to justify coding practice to others: personal experience and anecdote.
(It is perhaps more interesting to see which infamous metrics seem not to correlate with cost.)
Finally, elephant-in-the-room time.
All-together, now: CORRELATION IS NOT CAUSE! Yes: no one can guarantee that larger methods (for example) cost more to maintain and develop. But let's face it: most programmers think they do. These correlations do not prove that programmers are right to think this, but suggest that they are not silly for thinking it, either.
Summary.
(Spank!) I recently wrote a post post claiming that (spank!) a particular metric5 might be a good indicator (spank!) of source code structure. I was wrong. (Spank!) (Spank!) (Spank!)